Exploring Air Quality
Making sense of the data
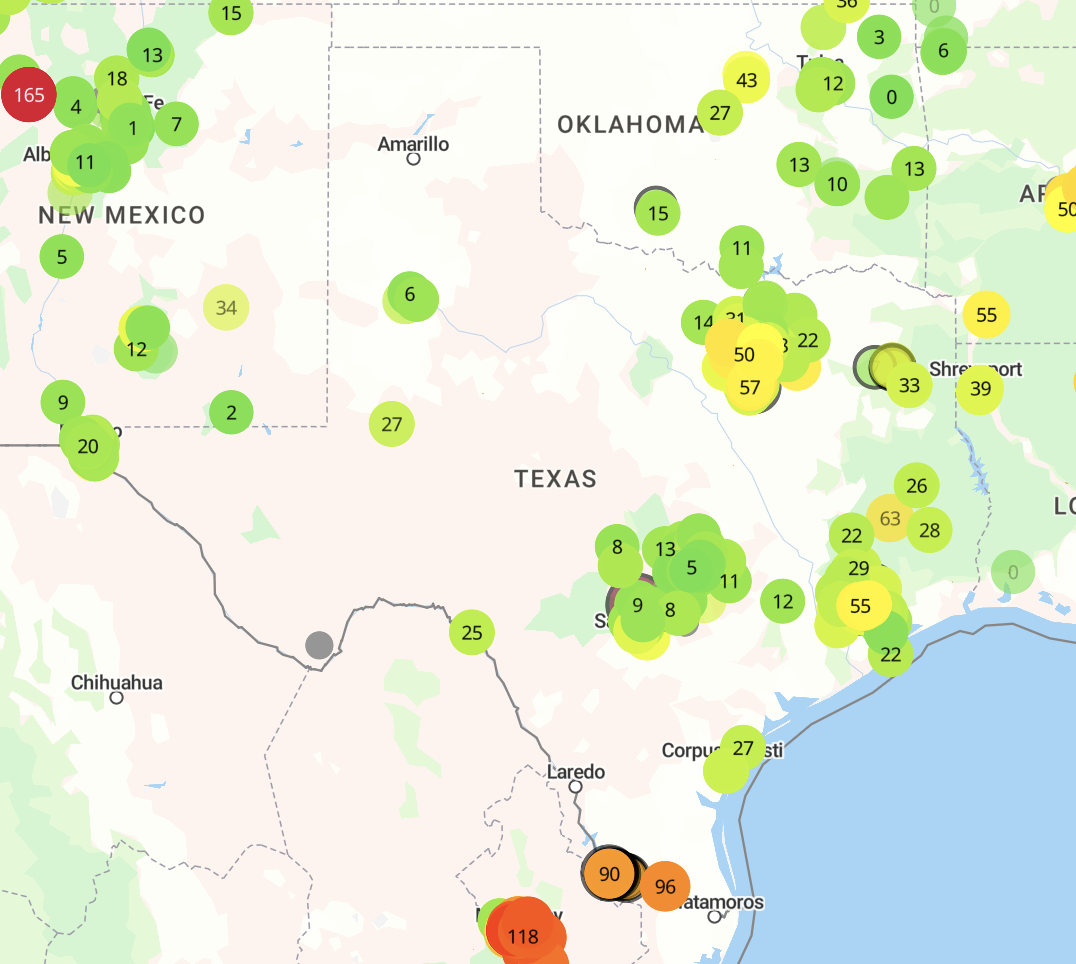
- Go to PurpleAir and explore the sensor map.
- Choose and click on a sensor that you are interested in exploring.
- Download the 60-min average for the last month.
- Hover over the “Get This Widget” text in the sensor information box to see a prompt to download the data.
- In the Sensor Data Download Tool that appears, set the start date and end date. Then set the average minutes to 60 and click download primary.
- Open the downloaded file using spreadsheet technology available to you (Excel, Googlesheets, etc.)
- Analyze the AQI -PM2.5 (measures of center, variability, range, best visualization(s) to make sense of the data).
- Share your data:
- What did you find?
- Why did you choose to model the data as you did?